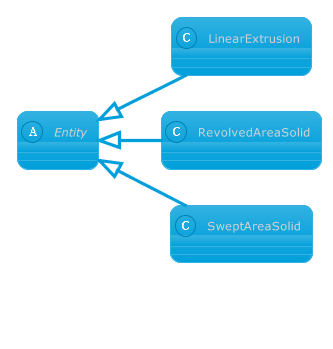
Sort Score
Result 10 results
Languages All
Labels All
Results 6,801 - 6,810 of 15,799 for

true type

(0.08 sec)
  1. Maak een grafiek in PPTX presentatiebestanden m...

    Python broncode om diagram te maken in PPTX presentatie.... NullableBool( True ) chart . chart_title . height...height = 20 chart . has_title = True # Set first series to show values...

    products.aspose.com/slides/nl/python-net/chart/...
  2. สร้างแผนภูมิในไฟล์การนำเสนอ PPT โดยใช้ Python |...

    ซอร์สโค้ด Python เพื่อสร้างแผนภูมิในการนำเสนอ PPT... NullableBool( True ) chart . chart_title . height...height = 20 chart . has_title = True # Set first series to show values...

    products.aspose.com/slides/th/python-net/chart/...
  3. Chercher

    chercher...fusionner plusieurs fichiers True Type Font (TTF) en un seul fichier...fusionner des fichiers de polices True Type en Java . Cet article couvre...

    blog.aspose.com/fr/font/merge-ttf-files-in-java/
  4. Python を使用したプレゼンテーション チャートのエラーバーのカスタマイズ|Aspose....

    Aspose.Slides for Python via .NET を使用してチャートにエラーバーを追加およびカスタマイズする方法を学び、PowerPoint と OpenDocument プレゼンテーションのデータ可視化を最適化します。...BUBBLE , 50 , 50 , 400 , 300 , True ) # エラーバーを追加し、その書式を設定 errBarX...is_visible = True errBarY . is_visible = True errBarX . value_type = charts...

    docs.aspose.com/slides/ja/python-net/error-bar/
  5. ایجاد نمودار در فایل های ارائه PPT با استفاده ا...

    کد منبع Python برای ایجاد نمودار در ارائه PPT.... NullableBool( True ) chart . chart_title . height...height = 20 chart . has_title = True # Set first series to show values...

    products.aspose.com/slides/fa/python-net/chart/...
  6. إنشاء مخطط في PPTX ملفات العروض التقديمية باستخ...

    كود مصدر Python لإنشاء مخطط في العرض التقديمي PPTX.... NullableBool( True ) chart . chart_title . height...height = 20 chart . has_title = True # Set first series to show values...

    products.aspose.com/slides/ar/python-net/chart/...
  7. Maak een grafiek in PPT presentatiebestanden me...

    Python broncode om diagram te maken in PPT presentatie.... NullableBool( True ) chart . chart_title . height...height = 20 chart . has_title = True # Set first series to show values...

    products.aspose.com/slides/nl/python-net/chart/...
  8. Aspose.PSD voor Java 23.8 - Notities bij uitgav...

    Class Libraries & REST APIs for the developers to manipulate & process Files from Word, Excel, PowerPoint, Visio, PDF, CAD & several other categories in Web, Desktop or Mobile apps. Develop & deploy on Windows, Linux, MacOS & Android platforms....PSDJAVA-518 Toevoegen van nieuw type warp (Vlag) Functie PSDJAVA-519...PSDJAVA-519 Toevoegen van nieuwe types warp: boog omhoog, boog omlaag...

    docs.aspose.com/psd/nl/java/aspose-psd-voor-jav...
  9. Python का उपयोग करके PPT प्रस्तुतिकरण फ़ाइलों म...

    PPT प्रस्तुतिकरण में चार्ट बनाने के लिए Python स्रोत कोड.... NullableBool( True ) chart . chart_title . height...height = 20 chart . has_title = True # Set first series to show values...

    products.aspose.com/slides/hi/python-net/chart/...
  10. Python을(를) 사용하여 PPT 프레젠테이션 파일로 차트 만들기 | product...

    PPT Presentation에서 차트를 생성하기 위한 Python 소스 코드.... NullableBool( True ) chart . chart_title . height...height = 20 chart . has_title = True # Set first series to show values...

    products.aspose.com/slides/ko/python-net/chart/...